In a previous tutorial we covered plotting in PyQt6 using PyQtGraph. PyQtGraph uses the Qt vector-based QGraphicsScene to draw plots and provides a great interface for interactive and high performance plotting.
However, there is another plotting library for Python which is used far more widely, and which offers a richer assortment of plots — Matplotlib. If you're migrating an existing data analysis tool to a Python GUI, or if you simply want to have access to the array of plot abilities that Matplotlib offers, then you'll want to know how to include Matplotlib plots within your application.
In this tutorial we'll cover how to embed Matplotlib plots in your PyQt applications
Many other Python libraries — such as seaborn and pandas— make use of the Matplotlib backend for plotting. These plots can be embedded in PyQt6 in the same way shown here, and the reference to the axes passed when plotting. There is a pandas example at the end of this tutorial.
Installing Matplotlib
The following examples assume you have Matplotlib installed. If not you can install it as normal using Pip, with the following —
pip install matplotlib
A Simple Example
The following minimal example sets up a Matplotlib canvas FigureCanvasQTAgg which creates the Figure and adds a single set of axes to it. This canvas object is also a QWidget and so can be embedded straight into an application as any other Qt widget.
import os
import sys

os.environ["QT_API"] = "PyQt6"

from PyQt6 import QtCore, QtWidgets
from matplotlib.backends.backend_qtagg import FigureCanvas
from matplotlib.figure import Figure


class MplCanvas(FigureCanvas):

    def __init__(self, parent=None, width=5, height=4, dpi=100):
        fig = Figure(figsize=(width, height), dpi=dpi)
        self.axes = fig.add_subplot(111)
        super().__init__(fig)


class MainWindow(QtWidgets.QMainWindow):

    def __init__(self, *args, **kwargs):
        super().__init__(*args, **kwargs)

        # Create the maptlotlib FigureCanvas object,
        # which defines a single set of axes as self.axes.
        sc = MplCanvas(self, width=5, height=4, dpi=100)
        sc.axes.plot([0,1,2,3,4], [10,1,20,3,40])
        self.setCentralWidget(sc)

        self.show()


app = QtWidgets.QApplication(sys.argv)
w = MainWindow()
app.exec()
In this case we're adding our MplCanvas widget as the central widget on the window with .setCentralWidget(). This means it will take up the entirety of the window and resize together with it. The plotted data [0,1,2,3,4], [10,1,20,3,40] is provided as two lists of numbers (x and y respectively) as required by the .plot method.
 Basic plot with embedded Matplotlib
Plot Controls
Plots from Matplotlib displayed in PyQt6 are actually rendered as simple (bitmap) images by the Agg backend. The FigureCanvasQTAgg class wraps this backend and displays the resulting image on a Qt widget. The effect of this architecture is that Qt is unaware of the positions of lines and other plot elements — only the x, y coordinates of any clicks and mouse movements over the widget.
However, support for handling Qt mouse events and transforming them into interactions on the plot is built into Matplotlib. This can be controlled through a custom toolbar which can be added to your applications alongside the plot. In this section we'll look at adding these controls so we can zoom, pan and get data from embedded Matplotlib plots.
The complete code, importing the toolbar widget NavigationToolbar2QT and adding it to the interface within a QVBoxLayout, is shown below —
Bring Your PyQt/PySide Application to Market — Specialized launch support for scientific and engineering software built using Python & Qt.
import os
import sys

os.environ["QT_API"] = "PyQt6"

from PyQt6 import QtCore, QtGui, QtWidgets

from matplotlib.backends.backend_qtagg import FigureCanvas
from matplotlib.backends.backend_qtagg import NavigationToolbar2QT as NavigationToolbar
from matplotlib.figure import Figure


class MplCanvas(FigureCanvasQTAgg):

    def __init__(self, parent=None, width=5, height=4, dpi=100):
        fig = Figure(figsize=(width, height), dpi=dpi)
        self.axes = fig.add_subplot(111)
        super().__init__(fig)


class MainWindow(QtWidgets.QMainWindow):

    def __init__(self, *args, **kwargs):
        super().__init__(*args, **kwargs)

        sc = MplCanvas(self, width=5, height=4, dpi=100)
        sc.axes.plot([0,1,2,3,4], [10,1,20,3,40])

        # Create toolbar, passing canvas as first parament, parent (self, the MainWindow) as second.
        toolbar = NavigationToolbar(sc, self)

        layout = QtWidgets.QVBoxLayout()
        layout.addWidget(toolbar)
        layout.addWidget(sc)

        # Create a placeholder widget to hold our toolbar and canvas.
        widget = QtWidgets.QWidget()
        widget.setLayout(layout)
        self.setCentralWidget(widget)

        self.show()


app = QtWidgets.QApplication(sys.argv)
w = MainWindow()
app.exec()
We'll step through the changes.
First we import the toolbar widget from matplotlib.backends.backend_qt5agg.NavigationToolbar2QT renaming it with the simpler name NavigationToolbar. We create an instance of the toolbar by calling NavigationToolbar with two parameters, first the canvas object sc and then the parent for the toolbar, in this case our MainWindow object self. Passing in the canvas links the created toolbar to it, allowing it to be controlled. The resulting toolbar object is stored in the variable toolbar.
We need to add two widgets to the window, one above the other, so we use a QVBoxLayout. First we add our toolbar widget toolbar and then the canvas widget sc to this layout. Finally, we set this layout onto our simple widget layout container which is set as the central widget for the window.
Running the above code will produce the following window layout, showing the plot at the bottom and the controls on top as a toolbar.
 Matplotlib plot with Toolbar
The buttons provided by NavigationToolbar2QT allow the following actions —
- Home, Back/Forward, Pan & Zoom which are used to navigate through the plots. The Back/Forward buttons can step backwards and forwards through navigation steps, for example zooming in and then clicking Back will return to the previous zoom. Home returns to the initial state of the plot.
- Plot margin/position configuration which can adjust the plot within the window.
- Axis/curve style editor, where you can modify plot titles and axes scales, along with setting plot line colours and line styles. The colour selection uses the platform-default colour picker, allowing any available colours to be selected.
- Save, to save the resulting figure as an image (all Matplotlib supported formats).
A few of these configuration settings are shown below.
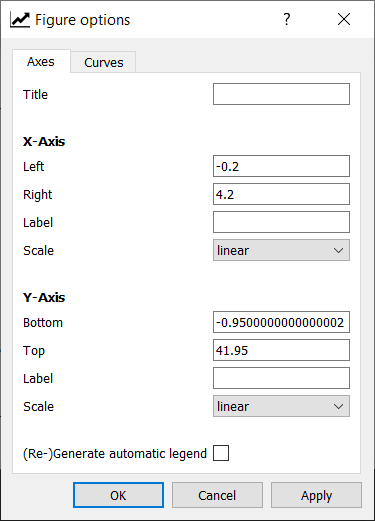 Matplotlib figure options
 Matplotlib curves figure options
For more information on navigating and configuring Matplotlib plots, take a look at the official Matplotlib toolbar documentation.
Updating Plots
Quite often in applications you'll want to update the data shown in plots, whether in response to input from the user or updated data from an API. There are two ways to update plots in Matplotlib, either
- clearing and redrawing the canvas (simpler, but slower) or,
- by keeping a reference to the plotted line and updating the data.
If performance is important to your app it is recommended you do the latter, but the first is simpler.
Clear and Redraw
We start with the simple clear-and-redraw method first below —
import sys
import os
import random

os.environ["QT_API"] = "PyQt6"

from PyQt6 import QtCore, QtWidgets
from matplotlib.backends.backend_qtagg import FigureCanvas
from matplotlib.figure import Figure


class MplCanvas(FigureCanvas):

    def __init__(self, parent=None, width=5, height=4, dpi=100):
        fig = Figure(figsize=(width, height), dpi=dpi)
        self.axes = fig.add_subplot(111)
        super().__init__(fig)


class MainWindow(QtWidgets.QMainWindow):

    def __init__(self, *args, **kwargs):
        super().__init__(*args, **kwargs)

        self.canvas = MplCanvas(self, width=5, height=4, dpi=100)
        self.setCentralWidget(self.canvas)

        n_data = 50
        self.xdata = list(range(n_data))
        self.ydata = [random.randint(0, 10) for i in range(n_data)]
        self.update_plot()

        self.show()

        # Setup a timer to trigger the redraw by calling update_plot.
        self.timer = QtCore.QTimer()
        self.timer.setInterval(100)
        self.timer.timeout.connect(self.update_plot)
        self.timer.start()

    def update_plot(self):
        # Drop off the first y element, append a new one.
        self.ydata = self.ydata[1:] + [random.randint(0, 10)]
        self.canvas.axes.cla()  # Clear the canvas.
        self.canvas.axes.plot(self.xdata, self.ydata, 'r')
        # Trigger the canvas to update and redraw.
        self.canvas.draw()


app = QtWidgets.QApplication(sys.argv)
w = MainWindow()
app.exec()
In this example we've moved the plotting to a update_plot method to keep it self-contained. In this method we take our ydata array and drop off the first value with [1:] then append a new random integer between 0 and 10. This has the effect of scrolling the data to the left.
To redraw we simply call axes.cla() to clear the axes (the entire canvas) and the axes.plot(…) to re-plot the data, including the updated values. The resulting canvas is then redrawn to the widget by calling canvas.draw().
The update_plot method is called every 100 msec using a QTimer. The clear-and-refresh method is fast enough to keep a plot updated at this rate, but as we'll see shortly, falters as the speed increases.
In-place Redraw
The changes required to update the plotted lines in-place are fairly minimal, requiring only an addition variable to store and retrieve the reference to the plotted line. The updated MainWindow code is shown below.
class MainWindow(QtWidgets.QMainWindow):

    def __init__(self, *args, **kwargs):
        super().__init__(*args, **kwargs)

        self.canvas = MplCanvas(self, width=5, height=4, dpi=100)
        self.setCentralWidget(self.canvas)

        n_data = 50
        self.xdata = list(range(n_data))
        self.ydata = [random.randint(0, 10) for i in range(n_data)]

        # We need to store a reference to the plotted line
        # somewhere, so we can apply the new data to it.
        self._plot_ref = None
        self.update_plot()

        self.show()

        # Setup a timer to trigger the redraw by calling update_plot.
        self.timer = QtCore.QTimer()
        self.timer.setInterval(100)
        self.timer.timeout.connect(self.update_plot)
        self.timer.start()

    def update_plot(self):
        # Drop off the first y element, append a new one.
        self.ydata = self.ydata[1:] + [random.randint(0, 10)]

        # Note: we no longer need to clear the axis.
        if self._plot_ref is None:
            # First time we have no plot reference, so do a normal plot.
            # .plot returns a list of line <reference>s, as we're
            # only getting one we can take the first element.
            plot_refs = self.canvas.axes.plot(self.xdata, self.ydata, 'r')
            self._plot_ref = plot_refs[0]
        else:
            # We have a reference, we can use it to update the data for that line.
            self._plot_ref.set_ydata(self.ydata)

        # Trigger the canvas to update and redraw.
        self.canvas.draw()
First, we need a variable to hold a reference to the plotted line we want to update, which here we're calling _plot_ref. We initialize self._plot_ref with None so we can check its value later to determine if the line has already been drawn — if the value is still None we have not yet drawn the line.
T> If you were drawing multiple lines you would probably want to use a list or dict data structure to store the multiple references and keep track of which is which.
Finally, we update the ydata data as we did before, rotating it to the left and appending a new random value. Then we either —
- if
self._plotrefisNone(i.e. we have not yet drawn the line) draw the line and store the reference inself._plot_ref, or - update the line in place by calling
self._plot_ref.set_ydata(self.ydata)
We obtain a reference to the plotted when calling .plot. However .plot returns a list (to support cases where a single .plot call can draw more than one line). In our case we're only plotting a single line, so we simply want the first element in that list – a single Line2D object. To get this single value into our variable we can assign to a temporary variable plot_refs and then assign the first element to our self._plot_ref variable.
plot_refs = self.canvas.axes.plot(self.xdata, self.ydata, 'r')
self._plot_ref = plot_refs[0]
You could also use tuple-unpacking, picking off the first (and only) element in the list with —
self._plot_ref, = self.canvas.axes.plot(self.xdata, self.ydata, 'r')
If you run the resulting code, there will be no noticeable difference in performance between this and the previous method at this speed. However if you attempt to update the plot faster (e.g. down to every 10 msec) you'll start to notice that clearing the plot and re-drawing takes longer, and the updates do not keep up with the timer. We can compare the two versions below —
Both using 100 msec timer, clear-and-redraw on the left, update-in-place on the right.
Both using 10 msec timer, clear-and-redraw on the left, update-in-place on the right.
Whether this performance difference is enough to matter in your application depends on what you're building, and should be weighed against the added complication of keeping and managing the references to plotted lines.
Embedding Plots from Pandas
Pandas is a Python package focused on working with table (data frames) and series data structures, which is particularly useful for data analysis workflows. It comes with built-in support for plotting with Matplotlib and here we'll take a quick look at how to embed these plots into PyQt6. With this you will be able to start building PyQt6 data-analysis applications built around Pandas.
The examples in this section require Pandas to be installed. If you don't already have it, you can install it using Pip:
pip install pandas
Pandas plotting functions are directly accessible from the DataFrame objects. The function signature is quite complex, giving a lot of options to control how the plots will be drawn.
DataFrame.plot(
    x=None, y=None, kind='line', ax=None, subplots=False,
    sharex=None, sharey=False, layout=None, figsize=None,
    use_index=True, title=None, grid=None, legend=True, style=None,
    logx=False, logy=False, loglog=False, xticks=None, yticks=None,
    xlim=None, ylim=None, rot=None, fontsize=None, colormap=None,
    table=False, yerr=None, xerr=None, secondary_y=False,
    sort_columns=False, **kwargs
)
The parameter we're most interested in is ax which allows us to pass in our own matplotlib.Axes instance on which Pandas will plot the DataFrame.
import os
import sys

os.environ["QT_API"] = "PyQt6"


from PyQt6 import QtCore, QtWidgets

from matplotlib.backends.backend_qtagg import FigureCanvas
from matplotlib.figure import Figure

import pandas as pd


class MplCanvas(FigureCanvasQTAgg):

    def __init__(self, parent=None, width=5, height=4, dpi=100):
        fig = Figure(figsize=(width, height), dpi=dpi)
        self.axes = fig.add_subplot(111)
        super().__init__(fig)


class MainWindow(QtWidgets.QMainWindow):

    def __init__(self, *args, **kwargs):
        super().__init__(*args, **kwargs)

        # Create the maptlotlib FigureCanvas object,
        # which defines a single set of axes as self.axes.
        sc = MplCanvas(self, width=5, height=4, dpi=100)

        # Create our pandas DataFrame with some simple
        # data and headers.
        df = pd.DataFrame([
           [0, 10], [5, 15], [2, 20], [15, 25], [4, 10],
        ], columns=['A', 'B'])

        # plot the pandas DataFrame, passing in the
        # matplotlib Canvas axes.
        df.plot(ax=sc.axes)

        self.setCentralWidget(sc)
        self.show()


app = QtWidgets.QApplication(sys.argv)
w = MainWindow()
app.exec()
The key step here is passing the canvas axes in when calling the plot method on the DataFrame on the line df.plot(ax=sc.axes). You can use this same pattern to update the plot any time, although bear in mind that Pandas clears and redraws the entire canvas, meaning that it is not ideal for high performance plotting.
The resulting plot generated through Pandas is shown below —
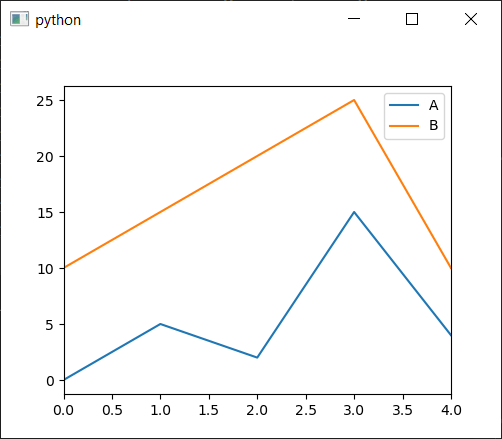 Pandas plot embedded in PyQt6
Just as before, you can add the Matplotlib toolbar and control support to plots generated using Pandas, allowing you to zoom/pan and modify them live. The following code combines our earlier toolbar example with the Pandas example.
import os
import sys

os.environ["QT_API"] = "PyQt6"

from PyQt6 import QtCore, QtWidgets

from matplotlib.backends.backend_qtagg import FigureCanvas
from matplotlib.backends.backend_qtagg import NavigationToolbar2QT as NavigationToolbar
from matplotlib.figure import Figure

import pandas as pd


class MplCanvas(FigureCanvasQTAgg):

    def __init__(self, parent=None, width=5, height=4, dpi=100):
        fig = Figure(figsize=(width, height), dpi=dpi)
        self.axes = fig.add_subplot(111)
        super().__init__(fig)


class MainWindow(QtWidgets.QMainWindow):

    def __init__(self, *args, **kwargs):
        super().__init__(*args, **kwargs)

        # Create the maptlotlib FigureCanvas object,
        # which defines a single set of axes as self.axes.
        sc = MplCanvas(self, width=5, height=4, dpi=100)

        # Create our pandas DataFrame with some simple
        # data and headers.
        df = pd.DataFrame([
           [0, 10], [5, 15], [2, 20], [15, 25], [4, 10],
        ], columns=['A', 'B'])

        # plot the pandas DataFrame, passing in the
        # matplotlib Canvas axes.
        df.plot(ax=sc.axes)

        # Create toolbar, passing canvas as first parament, parent (self, the MainWindow) as second.
        toolbar = NavigationToolbar(sc, self)

        layout = QtWidgets.QVBoxLayout()
        layout.addWidget(toolbar)
        layout.addWidget(sc)

        # Create a placeholder widget to hold our toolbar and canvas.
        widget = QtWidgets.QWidget()
        widget.setLayout(layout)
        self.setCentralWidget(widget)
        self.show()


app = QtWidgets.QApplication(sys.argv)
w = MainWindow()
app.exec()
Running this you should see the following window, showing a Pandas plot embedded in PyQt6 alongside the Matplotlib toolbar.
 Pandas plot with Matplotlib toolbar
What's Next
In this tutorial we looked at how you can embed Matplotlib plots in your PyQt6 applications. Being able to use Matplotlib plots in your applications allows you to create custom data analysis and visualization tools from Python.
Matplotlib is a huge library and too big to cover in detail here. If you're not familiar with Matplotlib plotting and want to give it a try, take a look at the documentation and example plots to see what is possible. If you are familiar with it you should now be able to put those skills to work in your PyQt6 apps!
For a more in-depth guide to building complete applications with PyQt6, take a look at our PyQt6 tutorial. You might also want to explore how to create your first app with PyQt6 to get started with the fundamentals.
PyQt/PySide Development Services — Stuck in development hell? I'll help you get your project focused, finished and released. Benefit from years of practical experience releasing software with Python.
