Goodforbitcoin is a simple cryptocurrency market tracker built with Python and PyQt5. It displays daily market rates, including high, low and close valuations, alongside market trade volume for a range of popular cryptocurrencies. It comes with built-in support for BTC, ETH, LTC, EOS, XRP and BCH currencies, with EUR, USD and GBP as base currencies for valuations.
The only Bitcoin I own I was given by some random chap on the internet. I am by no means knowledgeable about cryptocurrencies, this app is just for fun.
Read on for an overview of how the application is put together, including interacting with REST APIs from PyQt5, plotting cryptocurrency data with PyQtGraph and packaging Python apps with PyInstaller.
The app is powered by the CryptoCompare.com API from which we retrieve per-day high, low, open and close values, alongside market trading volume amounts. The resulting exchange rates are plotted using PyQtGraph along with a currency exchange list-view which is updated as you move your mouse through the plotted timeline. The bundled app is available for Windows and Mac.
Fetching Cryptocurrency Data from the CryptoCompare API
The first thing we need is a data source. Here we're using CryptoCompare.com which offers free developer API access for non-commercial purposes, including historic data.
Making API Calls with Python Requests
We're using two separate API calls to plot our graphs —
- The daily historic exchange values for all supported cryptocurrencies (
BTC,ETH,LTC,EOS,XRPandBCH) against a set of base-currencies (EUR,USDandGBP). - The daily market volume data, giving the amount of trades occurring.
The two API calls we are doing are...
https://min-api.cryptocompare.com/data/histoday?fsym={fsym}&tsym={tsym}&limit={limit}
https://min-api.cryptocompare.com/data/exchange/histoday?tsym={tsym}&limit={limit}
In the URLs fsym is the from symbol the currency converting from, tsym is to symbol the currency we're converting to, and limit which is the number of results to return on the request — since we're calling /histoday this is the number of days data to return.
The requests are performed with Python's requests library, passing a per-application key in an authentication Apikey header, e.g.
auth_header = {
    'Apikey': CRYPTOCOMPARE_API_KEY
}

url = 'https://min-api.cryptocompare.com/data/exchange/histoday?tsym={tsym}&limit={limit}'
r = requests.get(
    url.format(**{
        'tsym': self.base_currency,
        'limit': NUMBER_OF_TIMEPOINTS-1,
        'extraParams': 'www.mfitzp.com',
        'format': 'json',
    }),
    headers=auth_header,
)
Performing API Requests in Background Threads with QRunnable
Requests to APIs take time to complete. If we make the request directly in the GUI thread it will block the rest of the application executing — including responding to user input. The application would become unresponsive (spinning wheel of death, faded window).
We can avoid this problem quite easily by performing the API requests in a separate thread using PyQt5's QRunnable and QThreadPool.

Purchasing Power Parity
Developers in [[ country ]] get [[ discount.discount_pc ]]% OFF on all books & courses with code [[ discount.coupon_code ]] For a complete overview this QWorker approach see the PyQt5 threads tutorial.
First we define a signals QObject which contains the signals we want to emit from our worker thread. This includes signals to emit finished, error, progress (how much is complete) and data (the returned data).
class WorkerSignals(QObject):
    """
    Defines the signals available from a running worker thread.
    """
    finished = pyqtSignal()
    error = pyqtSignal(tuple)
    progress = pyqtSignal(int)
    data = pyqtSignal(dict, list)
    cancel = pyqtSignal()
We also add a cancel signal which allows the parent app to signal to an active worker thread when a new request has been queued before the first one completes. This signal sets a flag is_interrupted on the worker, which is checked before each currency's data is downloaded. If True it will return without emitting the finished signal.
class UpdateWorker(QRunnable):
    """
    Worker thread for updating currency data from the CryptoCompare API.
    """
    signals = WorkerSignals()

    def __init__(self, base_currency):
        super().__init__()
        self.is_interrupted = False
        self.base_currency = base_currency
        self.signals.cancel.connect(self.cancel)

    @pyqtSlot()
    def run(self):
        auth_header = {
            'Apikey': CRYPTOCOMPARE_API_KEY
        }
        try:
            rates = {}
            for n, crypto in enumerate(AVAILABLE_CRYPTO_CURRENCIES, 1):
                url = 'https://min-api.cryptocompare.com/data/histoday?fsym={fsym}&tsym={tsym}&limit={limit}'
                r = requests.get(
                    url.format(**{
                        'fsym': crypto,
                        'tsym': self.base_currency,
                        'limit': NUMBER_OF_TIMEPOINTS-1,
                        'extraParams': 'www.mfitzp.com',
                        'format': 'json',
                    }),
                    headers=auth_header,
                )
                r.raise_for_status()
                rates[crypto] = r.json().get('Data')

                self.signals.progress.emit(int(100 * n / len(AVAILABLE_CRYPTO_CURRENCIES)))

                if self.is_interrupted:
                    # Stop without emitting finish signals.
                    return

            url = 'https://min-api.cryptocompare.com/data/exchange/histoday?tsym={tsym}&limit={limit}'
            r = requests.get(
                url.format(**{
                    'tsym': self.base_currency,
                    'limit': NUMBER_OF_TIMEPOINTS-1,
                    'extraParams': 'www.mfitzp.com',
                    'format': 'json',
                }),
                headers=auth_header,
            )
            r.raise_for_status()
            volume = [d['volume'] for d in r.json().get('Data')]

        except Exception as e:
            self.signals.error.emit((e, traceback.format_exc()))
            return

        self.signals.data.emit(rates, volume)
        self.signals.finished.emit()

    def cancel(self):
        self.is_interrupted = True
A separate API request is performed for each cryptocurrency, updating the progress bar (emitting (int(100 * n / len(AVAILABLE_CRYPTO_CURRENCIES))) on each iteration) and then a final request is made to retrieve the volume information. Once all requests are finished the resulting data is emitted using the earlier defined signals.
Caching API Responses with requests_cache
The free API comes with a generous limit of 100,000 calls/month, which you're unlikely to hit. However, it's still polite not to waste other people's bandwidth if you can avoid it. Since we're retrieving daily rates, there isn't any reason to download >1 time per day.
As we're performing the API calls using the requests library we can use requests_cache to automatically cache all our API requests transparently. This uses a simple SQLite file database to store the results of previous requests.
import requests_cache
requests_cache.install_cache(os.path.expanduser('~/.goodforbitcoin'))
With the cache enabled API responses will be cached and subsequent requests to the same URL will fetch from the cache (until it expires, set to 1 day by the API).
You can put the cache wherever you want on disk, the only requirement is that it is user-writeable (so it continues to work after the app is packaged).
Plotting Cryptocurrency Charts with PyQtGraph
The API calls return high, low, open and close values for each day and for each cryptocurrency in addition to a separate market volume value. These are plotted as a series of lines, with each cryptocurrency close value plotted in a different colour, with high and low values drawn as dotted lines either side. The open value is not plotted.
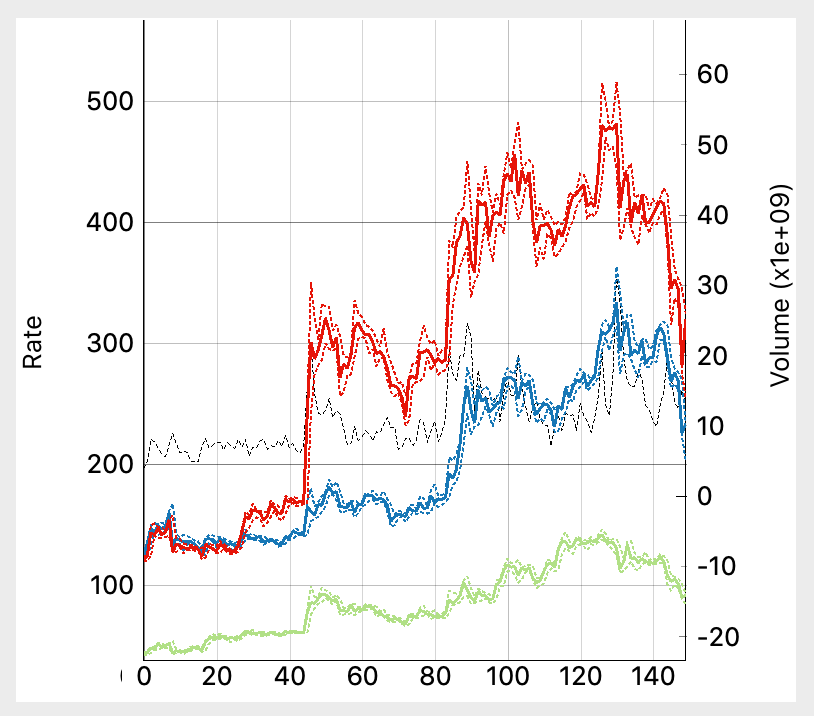 PyQtGraph plot with multiple currencies and volume data
Setting Up the Currency Axis
The currency values are all plotted on the same scale, using the same axis. We only plot the currency lines once we have the data back from the API (in case any currencies are not activated) so the initial setup is just of the axis and grid. We also set the axis names, and add an infinite vertical line, which is used to track through the plot to get per-day currency conversion rates.
self.ax = pg.PlotWidget()
self.ax.showGrid(True, True)

self.line = pg.InfiniteLine(
    pos=-20,
    pen=pg.mkPen('k', width=3),
    movable=False  # We have our own code to handle dragless moving.
)

self.ax.addItem(self.line)
self.ax.setLabel('left', text='Rate')
self.p1 = self.ax.getPlotItem()
self.p1.scene().sigMouseMoved.connect(self.mouse_move_handler)
The axis' mouse move signal is connected to the custom mouse_move_handler slot, which moves the infinite line and updates the current rates shown in the rates table (see later).
Adding a Secondary Volume Axis in PyQtGraph
The volume axis is plotted on a separate scale, as a dotted black line. This can be zoomed vertically independently of the currencies. This is a bit tricky to achieve in PyQtGraph, requiring you to manually create a ViewBox object and connect it up to the main axis.
# Add the right-hand axis for the market activity.
self.p2 = pg.ViewBox()
self.p2.enableAutoRange(axis=pg.ViewBox.XYAxes, enable=True)
self.p1.showAxis('right')
self.p1.scene().addItem(self.p2)
self.p2.setXLink(self.p1)
self.ax2 = self.p1.getAxis('right')
self.ax2.linkToView(self.p2)
self.ax2.setGrid(False)
self.ax2.setLabel(text='Volume')
Unlike for the currencies we do add the curve here, since we know it will always be present. The initial state is a diagonal line (for no reason).
self._market_activity = pg.PlotCurveItem(
    np.arange(NUMBER_OF_TIMEPOINTS), np.arange(NUMBER_OF_TIMEPOINTS),
    pen=pg.mkPen('k', style=Qt.DashLine, width=1)
)
self.p2.addItem(self._market_activity)

# Automatically rescale our twinned Y axis.
self.p1.vb.sigResized.connect(self.update_plot_scale)
We need to connect the resized signal from the primary axis to our custom update_plot_scale slot, to automatically update the secondary axis dimensions.
def update_plot_scale(self):
    self.p2.setGeometry(self.p1.vb.sceneBoundingRect())
Now the two axes are defined, we can draw our plot lines.
Updating the Plot with New Cryptocurrency Data
The plot is updated in response to the data being returned by the API request worker. This triggers the .redraw() method, which uses the data (available on self.data) to either add, or update lines to the plot.
    def redraw(self):
        y_min, y_max = sys.maxsize, 0
        x = np.arange(NUMBER_OF_TIMEPOINTS)

        # Pre-process data into lists of x, y values.
        for currency, data in self.data.items():
            if data:
                _, close, high, low = zip(*[
                    (v['time'], v['close'], v['high'], v['low'])
                    for v in data
                ])

                if currency in self._data_visible:
                    # This line should be visible, if it's not drawn draw it.
                    if currency not in self._data_lines:
                        self._data_lines[currency] = {}
                        self._data_lines[currency]['high'] = self.ax.plot(
                            x, high,  # Unpack a list of tuples into two lists, passed as individual args.
                            pen=pg.mkPen(self.get_currency_color(currency), width=2, style=Qt.DotLine)
                        )
                    else:
                        self._data_lines[currency]['high'].setData(x, high)

                    y_min, y_max = min(y_min, *low), max(y_max, *high)

                else:
                    # This line should not be visible, if it is delete it.
                    if currency in self._data_lines:
                        self._data_lines[currency]['high'].clear()
    ...
References to plotted lines are kept in a dictionary self._data_lines keyed by the cryptocurrency identifier. This allows us to check on each update whether we already have a line defined, and update it rather than recreating it. We can also remove lines for currencies that we no longer want to draw (if they've been deselected in the currency list).
The market activity (volume) plot however is always there, so we can just perform a simple update to the existing line.
self._market_activity.setData(x, self.volume)
In addition to the plotted lines, we also show a list with the currency conversion rates for all cryptocurrencies at the current position in the graph. As you move your pointer back and forward these rates update automatically.
Building a Rates Table with QTableView and QStandardItemModel
The rates table is a QTableView widget, using the Qt5 ModelView architecture.
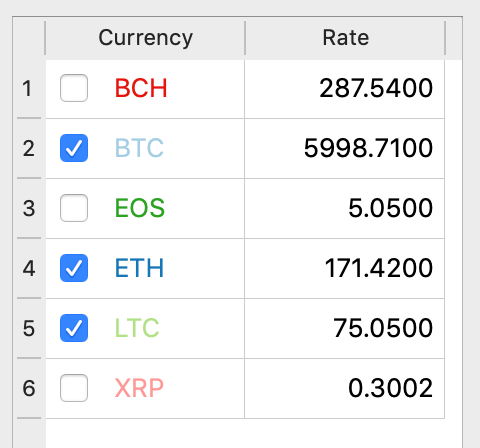 Goodforbitcoin rates table
We define a QStandardItemModel model which we can use to update the data in the table, and set the headers for the columns. Finally, the .itemChanged signal is connected to our custom slot method check_check_state.
self.listView = QTableView()
self.model = QStandardItemModel()
self.model.setHorizontalHeaderLabels(["Currency", "Rate"])
self.model.itemChanged.connect(self.check_check_state)
If the item is checked, and the currency is not currently displayed (the currency identifier is not in our ._data_visible map) we add the currency to it and trigger a redraw. Likewise, if the item is unchecked but the currency is displayed, we remove it and trigger a redraw.
def check_check_state(self, i):
    if not i.isCheckable():  # Skip data columns.
        return

    currency = i.text()
    checked = i.checkState() == Qt.Checked

    if currency in self._data_visible:
        if not checked:
            self._data_visible.remove(currency)
            self.redraw()
    else:
        if checked:
            self._data_visible.append(currency)
            self.redraw()
We always download data for all currencies, even if they are not currently displayed, so we can update the plot immediately. You might want to have a go at changing this behavior.
To automatically update the values on the rates table we have already connected our mouse_move_handler slot to mouse moves on the main axis. This slot receives a pos value which is a QPoint position relative to the axis. We first use the .x() value to set the position of the vertical line, and then hand off the int of the value to our update_data_viewer method.
def mouse_move_handler(self, pos):
    pos = self.ax.getViewBox().mapSceneToView(pos)
    self.line.setPos(pos.x())
    self.update_data_viewer(int(pos.x()))
This next method checks if the position i is within the range of our data (the number of days of data we have). Then for each currency it gets the corresponding value (the close value) and then sets this onto the second QStandardItems — the column with the currency exchange rates — as a 4dp number.
def update_data_viewer(self, i):
    if i not in range(NUMBER_OF_TIMEPOINTS):
        return

    for currency, data in self.data.items():
        self.update_data_row(currency, data[i])

def update_data_row(self, currency, data):
    citem, vitem = self.get_or_create_data_row(currency)
    vitem.setText("%.4f" % data['close'])
The get_or_create_data_row looks to see if a data row exists in the model for the corresponding currency. If it does it returns the existing row, if not it creates a new row by calling add_data_row. This means we don't need to define the rows explicitly, they are created automatically based on the data returned by the API.
def get_or_create_data_row(self, currency):
    if currency not in self._data_items:
        self._data_items[currency] = self.add_data_row(currency)
    return self._data_items[currency]

def add_data_row(self, currency):
    citem = QStandardItem()
    citem.setText(currency)
    citem.setForeground(QBrush(QColor(
        self.get_currency_color(currency)
    )))
    citem.setColumnCount(2)
    citem.setCheckable(True)
    if currency in DEFAULT_DISPLAY_CURRENCIES:
        citem.setCheckState(Qt.Checked)

    vitem = QStandardItem()

    vitem.setTextAlignment(Qt.AlignRight | Qt.AlignVCenter)
    self.model.setColumnCount(2)
    self.model.appendRow([citem, vitem])
    self.model.sort(0)
    return citem, vitem
Packaging the Python App with PyInstaller
Now we have the working app, the last step is to bundle it up for distribution. Installers for Windows and Mac are available at the top of this article. To do this we're using PyInstaller, the current standard for bundling Python applications into standalone executables.
Because this app has no external data files building an installer for it is pretty straightforward. Install PyInstaller with pip3 install pyinstaller then run —
pyinstaller crypto.py
This produces a spec file which contains the information needed by PyInstaller to build the distribution installers. This file is cross-platform and should be included in your source control so any improvements are persisted.
The automatically generated file is enough to package this application as-is, but we need a few tweaks to make it complete.
Enabling macOS Retina Support
By default macOS applications don't support retina (high resolution) screens. To enable this support you need to set the NSHighResolutionCapable flag in the application .plist bundled inside the .app. This is simple enough to do in PyInstaller.
Edit the .spec file to add the info_plist block shown below, with NSHighResolutionCapable
app = BUNDLE(coll,
            ...
             info_plist={
                 'NSHighResolutionCapable': 'True'
             },
Now, whenever you bundle your application, this flag will be added to the macOS bundle .plist automatically.
Adding Application Icons
To make the application show a custom icon while running we need to generate Windows .ico and macOS .icns files and add these to the .spec definition.
A macOS icon bundle icon.icns contains multiple alternative icon sizes, which are laborious to generate by hand. The following script will take a single .png file input and automatically generate an .icns bundle containing the different sizes.
#!/bin/bash

mkdir $1.iconset
sips -z 16 16     $1 --out $1.iconset/icon_16x16.png
sips -z 32 32     $1 --out $1.iconset/icon_16x16@2x.png
sips -z 32 32     $1 --out $1.iconset/icon_32x32.png
sips -z 64 64     $1 --out $1.iconset/icon_32x32@2x.png
sips -z 128 128   $1 --out $1.iconset/icon_128x128.png
sips -z 256 256   $1 --out $1.iconset/icon_128x128@2x.png
sips -z 256 256   $1 --out $1.iconset/icon_256x256.png
sips -z 512 512   $1 --out $1.iconset/icon_256x256@2x.png
sips -z 512 512   $1 --out $1.iconset/icon_512x512.png
cp $1 $1.iconset/icon_512x512@2x.png
iconutil -c icns $1.iconset
rm -R $1.iconset
This file saved as makeicns.sh and chmod +x makeicns.sh can then be used to generate an .icns bundle from a single large PNG, as follows.
./makeicns.sh bitcoin-icon.png
You may want to check the resized icons and edit the lower resolution ones to simplify them to improve clarity. Just remove the rm -R $1.iconset step from the script.
For Windows we can generate an .ico file by loading a PNG into Gimp and resize down to 64x64, 32x32 and 16x16 on separate layers. Unlike for macOS you can provide a single square image if you are happy to let it be resized automatically, just ensure it is saved as .ico.
The Completed PyInstaller Spec File
To complete the spec file we can manually set the name of the application (to Goodforbitcoin) and update the filenames for the bundled applications to match. In addition the PyInstaller script will have added a pathex variable with a static path.
pathex=['/Users/martin/repos/minute-apps/crypto'],
The pathex will be different if you generate this file yourself.
This can be removed if the .spec file is in the same folder as your application's base Python file to make the file portable. The last step is to add a number of hidden imports (modules which are not correctly detected by PyInstaller). These are only necessary for the Windows builds.
The completed spec file used to bundle the downloads is shown below.
# -*- mode: python ; coding: utf-8 -*-

block_cipher = None


a = Analysis(['crypto.py'],
             binaries=[],
             datas=[],
             hiddenimports=[
             'numpy.random.common',
             'numpy.random.bounded_integers',
             'numpy.random.entropy',
             ],
             hookspath=[],
             runtime_hooks=[],
             excludes=[],
             win_no_prefer_redirects=False,
             win_private_assemblies=False,
             cipher=block_cipher,
             noarchive=False)
pyz = PYZ(a.pure, a.zipped_data,
             cipher=block_cipher)
exe = EXE(pyz,
          a.scripts,
          [],
          exclude_binaries=True,
          name='Goodforbitcoin',
          debug=False,
          bootloader_ignore_signals=False,
          strip=False,
          upx=True,
          console=False,
          icon='resources/icon.ico'
          )
coll = COLLECT(exe,
               a.binaries,
               a.zipfiles,
               a.datas,
               strip=False,
               upx=True,
               upx_exclude=[],
               name='Goodforbitcoin')
app = BUNDLE(coll,
             name='Goodforbitcoin.app',
             icon='resources/icon.icns',
             bundle_identifier='com.learnpyqt.Goodforbitcoin',
             info_plist={
                 'NSHighResolutionCapable': 'True'
             },
)
The packaged Goodforbitcoin apps, along with the source code, can be downloaded using the links below.
Create GUI Applications with Python & Qt5 by Martin Fitzpatrick — (PyQt5 Edition) The hands-on guide to making apps with Python — Save time and build better with this book. Over 15K copies sold.
