When you embed a PyQtGraph plot inside a PyQt5 application, you might want to give your users a visual indicator of exactly where the cursor is on the plot. A common way to do this is with a crosshair — two thin lines (one vertical, one horizontal) that follow the mouse as it moves over the chart.
In this tutorial, we'll walk through how to add a crosshair to a PyQtGraph PlotWidget and keep it updated as the mouse moves. We'll also display the current cursor coordinates as text on the plot, so users can read the exact values.
Setting Up the Basic Plot
Let's start with a simple PyQt5 application that displays a line chart using PyQtGraph. If you've followed the embedding PyQtGraph tutorial, this will look familiar.
from PyQt5 import QtWidgets
import pyqtgraph as pg
import sys


class MainWindow(QtWidgets.QMainWindow):
    def __init__(self, *args, **kwargs):
        super().__init__(*args, **kwargs)

        self.graphWidget = pg.PlotWidget()
        self.setCentralWidget(self.graphWidget)

        hour = [1, 2, 3, 4, 5, 6, 7, 8, 9, 10]
        temperature = [30, 32, 34, 32, 33, 31, 29, 32, 35, 45]

        self.graphWidget.setBackground("w")
        self.graphWidget.setTitle("Your Title Here", color="b", size="30pt")

        styles = {"color": "#f00", "font-size": "20px"}
        self.graphWidget.setLabel("left", "Temperature (°C)", **styles)
        self.graphWidget.setLabel("bottom", "Hour (H)", **styles)

        self.graphWidget.addLegend()
        self.graphWidget.showGrid(x=True, y=True)
        self.graphWidget.setXRange(0, 10, padding=0)
        self.graphWidget.setYRange(20, 55, padding=0)

        pen = pg.mkPen(color=(255, 0, 0))
        self.graphWidget.plot(
            hour,
            temperature,
            name="Sensor 1",
            pen=pen,
            symbol="+",
            symbolSize=30,
            symbolBrush="b",
        )


app = QtWidgets.QApplication(sys.argv)
main = MainWindow()
main.show()
sys.exit(app.exec_())
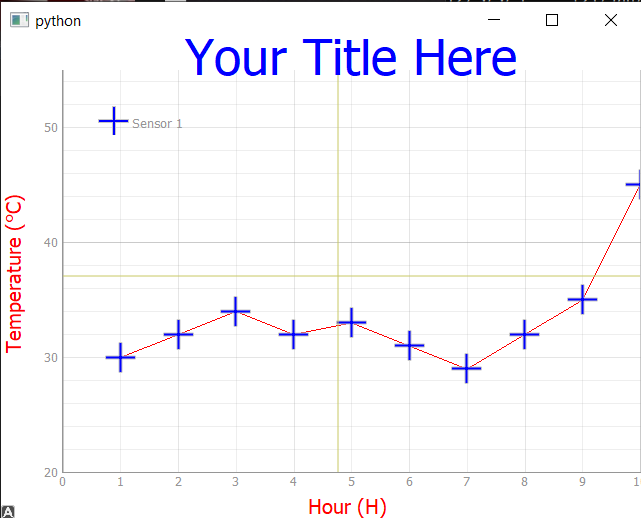
This gives us a styled plot with labeled axes, a grid, and a single data series. Now we can add the crosshair on top.
Adding the Crosshair Lines
PyQtGraph provides InfiniteLine, a line item that stretches across the entire plot in one direction. By creating two of these — one vertical (angle=90) and one horizontal (angle=0) — we get a crosshair.
Add the following lines inside __init__, after the call to self.graphWidget.plot(...):
# Add crosshair lines.
self.crosshair_v = pg.InfiniteLine(angle=90, movable=False)
self.crosshair_h = pg.InfiniteLine(angle=0, movable=False)
self.graphWidget.addItem(self.crosshair_v, ignoreBounds=True)
self.graphWidget.addItem(self.crosshair_h, ignoreBounds=True)
The angle=90 line is vertical, and angle=0 is horizontal. We pass movable=False because we don't want the user to drag them — they should follow the mouse automatically. The ignoreBounds=True argument tells PyQtGraph not to consider these lines when auto-scaling the view, which prevents the plot from jumping around.
At this point the lines exist, but they just sit at position zero. We need to move them whenever the mouse moves.
Tracking Mouse Movement with SignalProxy
PyQtGraph's scene emits a sigMouseMoved signal every time the mouse moves over the plot area. We could connect directly to it, but that would fire for every single pixel the cursor crosses — potentially hundreds of times per second. That's more updates than we need and can slow things down.
Purchasing Power Parity
Developers in [[ country ]] get [[ discount.discount_pc ]]% OFF on all books & courses with code [[ discount.coupon_code ]]Instead, we use pg.SignalProxy to throttle the signal to a reasonable rate (60 updates per second is plenty for a smooth crosshair). Add this line right after the crosshair setup:
self.proxy = pg.SignalProxy(
    self.graphWidget.scene().sigMouseMoved,
    rateLimit=60,
    slot=self.mouse_moved,
)
We store the proxy as self.proxy so it doesn't get garbage-collected. The slot parameter tells it which method to call when a mouse movement comes through. If you're new to the concept of signals and slots in Qt, our PyQt5 signals, slots & events tutorial covers the fundamentals.
Now let's write that mouse_moved method. Add it to the MainWindow class:
def mouse_moved(self, e):
    pos = e[0]
    if self.graphWidget.sceneBoundingRect().contains(pos):
        mouse_point = self.graphWidget.getPlotItem().vb.mapSceneToView(pos)
        self.crosshair_v.setPos(mouse_point.x())
        self.crosshair_h.setPos(mouse_point.y())
Here's what's happening in this method:
- The signal gives us a tuple, and
e[0]is the position of the mouse in scene coordinates (pixel coordinates within the graphics scene). - We check that the mouse is actually inside the plot area using
sceneBoundingRect().contains(pos). This prevents the crosshair from updating when the cursor is over the axis labels or legend. - We convert the scene coordinates to view coordinates (the actual data values on the axes) using
mapSceneToView. This is what makes the crosshair line up correctly with the data. - We update each
InfiniteLineto the new position.
Displaying Coordinates as Text
A crosshair is helpful, but showing the actual x/y values makes it even more useful. We can add a TextItem to the plot that updates alongside the crosshair.
First, create the text item in __init__, alongside the crosshair lines:
self.cursor_label = pg.TextItem(text="", color="k", anchor=(0, 1))
self.graphWidget.addItem(self.cursor_label, ignoreBounds=True)
The anchor=(0, 1) places the text so its bottom-left corner sits at the position we assign. Using color="k" gives us black text, which works well on our white background.
Then update the mouse_moved method to set the text and position of the label:
def mouse_moved(self, e):
    pos = e[0]
    if self.graphWidget.sceneBoundingRect().contains(pos):
        mouse_point = self.graphWidget.getPlotItem().vb.mapSceneToView(pos)
        self.crosshair_v.setPos(mouse_point.x())
        self.crosshair_h.setPos(mouse_point.y())
        self.cursor_label.setText(
            f"x={mouse_point.x():.2f}, y={mouse_point.y():.2f}"
        )
        self.cursor_label.setPos(mouse_point.x(), mouse_point.y())
Now the label follows the cursor and shows the coordinates rounded to two decimal places.
Complete Working Example
Here's the full application with the crosshair and coordinate label:
from PyQt5 import QtWidgets
import pyqtgraph as pg
import sys


class MainWindow(QtWidgets.QMainWindow):
    def __init__(self, *args, **kwargs):
        super().__init__(*args, **kwargs)

        self.graphWidget = pg.PlotWidget()
        self.setCentralWidget(self.graphWidget)

        hour = [1, 2, 3, 4, 5, 6, 7, 8, 9, 10]
        temperature = [30, 32, 34, 32, 33, 31, 29, 32, 35, 45]

        # Style the plot.
        self.graphWidget.setBackground("w")
        self.graphWidget.setTitle("Your Title Here", color="b", size="30pt")

        styles = {"color": "#f00", "font-size": "20px"}
        self.graphWidget.setLabel("left", "Temperature (°C)", **styles)
        self.graphWidget.setLabel("bottom", "Hour (H)", **styles)

        self.graphWidget.addLegend()
        self.graphWidget.showGrid(x=True, y=True)
        self.graphWidget.setXRange(0, 10, padding=0)
        self.graphWidget.setYRange(20, 55, padding=0)

        # Plot data.
        pen = pg.mkPen(color=(255, 0, 0))
        self.graphWidget.plot(
            hour,
            temperature,
            name="Sensor 1",
            pen=pen,
            symbol="+",
            symbolSize=30,
            symbolBrush="b",
        )

        # Add crosshair lines.
        self.crosshair_v = pg.InfiniteLine(angle=90, movable=False)
        self.crosshair_h = pg.InfiniteLine(angle=0, movable=False)
        self.graphWidget.addItem(self.crosshair_v, ignoreBounds=True)
        self.graphWidget.addItem(self.crosshair_h, ignoreBounds=True)

        # Add a text label for coordinates.
        self.cursor_label = pg.TextItem(text="", color="k", anchor=(0, 1))
        self.graphWidget.addItem(self.cursor_label, ignoreBounds=True)

        # Use a SignalProxy to throttle mouse move events.
        self.proxy = pg.SignalProxy(
            self.graphWidget.scene().sigMouseMoved,
            rateLimit=60,
            slot=self.mouse_moved,
        )

    def mouse_moved(self, e):
        pos = e[0]
        if self.graphWidget.sceneBoundingRect().contains(pos):
            mouse_point = self.graphWidget.getPlotItem().vb.mapSceneToView(pos)
            self.crosshair_v.setPos(mouse_point.x())
            self.crosshair_h.setPos(mouse_point.y())
            self.cursor_label.setText(
                f"x={mouse_point.x():.2f}, y={mouse_point.y():.2f}"
            )
            self.cursor_label.setPos(mouse_point.x(), mouse_point.y())


app = QtWidgets.QApplication(sys.argv)
main = MainWindow()
main.show()
sys.exit(app.exec_())
Run this and move your mouse over the plot. You'll see the crosshair lines follow the cursor, and the text label shows the current coordinates in data-space.
Customizing the Crosshair Appearance
You can style the crosshair lines with a custom pen. For example, to make them dashed and semi-transparent:
crosshair_pen = pg.mkPen(color=(0, 0, 0, 120), width=1, style=pg.QtCore.Qt.DashLine)
self.crosshair_v = pg.InfiniteLine(angle=90, movable=False, pen=crosshair_pen)
self.crosshair_h = pg.InfiniteLine(angle=0, movable=False, pen=crosshair_pen)
The fourth value in the color tuple (0, 0, 0, 120) is the alpha (transparency), where 255 is fully opaque and 0 is invisible. A semi-transparent dashed line gives a subtler look that won't distract from your data.
You can also customize the text label's font size and background:
self.cursor_label = pg.TextItem(
    text="",
    color="k",
    anchor=(0, 1),
    fill=pg.mkBrush(255, 255, 255, 180),
)
Adding a fill brush gives the label a semi-transparent white background, making it easier to read when it overlaps with data points or grid lines.
For more on plotting with PyQtGraph including line styles, colors, and multiple data series, see the full plotting with PyQtGraph tutorial. If you'd prefer to use Matplotlib for your embedded plots instead, take a look at plotting with Matplotlib in PyQt5.
Create GUI Applications with Python & Qt6 by Martin Fitzpatrick — (PyQt6 Edition) The hands-on guide to making apps with Python — Save time and build better with this book. Over 15K copies sold.
