I followed the Embed PyQtGraph tutorial and tried to rewrite the code to use PySide instead of PyQt5, using QtPy. But I can't get
graphWidget(a PyQtGraphPlotWidget) to work — the plot either appears outside the main window or doesn't show at all. How do I embed a PyQtGraph plot inside a PySide6 application?
When you use QtPy (a compatibility layer that lets you write code that works across PyQt5, PyQt6, PySide2, and PySide6), it needs to know which Qt binding you actually want to use. If you don't tell it, QtPy will pick one automatically — and it might pick PyQt5, even if the rest of your code imports from PySide6.
This mismatch causes problems. Your .ui file gets loaded using one Qt binding while your application runs on another, and widgets like the promoted PlotWidget from PyQtGraph don't get wired up correctly.
The Fix: Set the QT_API Environment Variable
The solution is to tell QtPy which binding to use before any Qt imports happen. You do this by setting the QT_API environment variable at the very top of your script:
import os
os.environ["QT_API"] = "pyside6"
This must come before you import anything from PySide6, QtPy, or PyQtGraph. Once this is set, QtPy will use PySide6 under the hood, and everything — including uic.loadUi() and promoted widgets — will work with the correct binding.
Complete Working Example
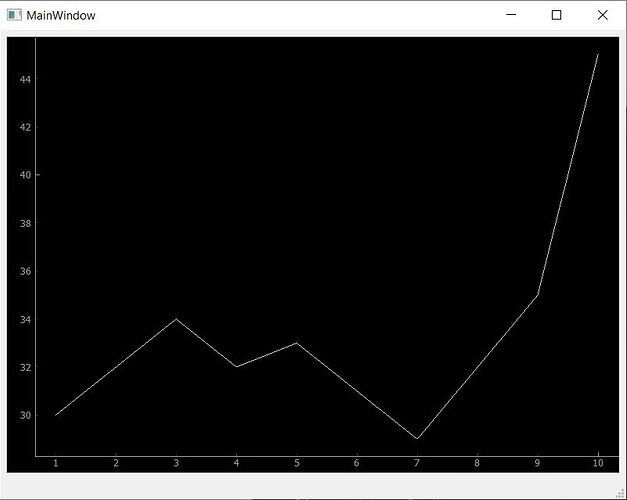
Here's a full example that loads a .ui file containing a promoted PlotWidget named graphWidget and plots some data on it:
import os
import sys

os.environ["QT_API"] = "pyside6"

from PySide6 import QtWidgets
from qtpy import uic


class MainWindow(QtWidgets.QMainWindow):
    def __init__(self):
        super().__init__()

        uic.loadUi("mainwindow.ui", self)  # Load the UI Page
        self.plot(
            [1, 2, 3, 4, 5, 6, 7, 8, 9, 10],
            [30, 32, 34, 32, 33, 31, 29, 32, 35, 45],
        )

    def plot(self, hour, temperature):
        self.graphWidget.plot(hour, temperature)


def main():
    app = QtWidgets.QApplication(sys.argv)
    main_window = MainWindow()
    main_window.show()
    sys.exit(app.exec())


if __name__ == "__main__":
    main()
A few things to notice in this code:
os.environ["QT_API"] = "pyside6"is set right at the top, before any Qt-related imports.self.graphWidgetrefers to thePlotWidgetthat was promoted in Qt Designer insidemainwindow.ui. The namegraphWidgetis just the object name you gave it in the designer — it's not a PyQt5-specific feature.- We use
app.exec()(without the underscore) since PySide6 usesexec()directly.
What About the .ui File?
The .ui file itself doesn't need to change between PyQt5 and PySide6. The promoted widget inside it references pyqtgraph.PlotWidget, and PyQtGraph handles the abstraction across Qt bindings internally. As long as the QT_API variable is set correctly, PyQtGraph will use the right binding when the widget is created.
If you haven't set up the .ui file yet, you can follow the Embed PyQtGraph custom widgets tutorial for step-by-step instructions on promoting a widget to PlotWidget in Qt Designer.

Purchasing Power Parity
Developers in [[ country ]] get [[ discount.discount_pc ]]% OFF on all books & courses with code [[ discount.coupon_code ]]Why Does This Happen?
QtPy supports multiple Qt bindings and tries to be helpful by auto-detecting which one is installed. If you have both PyQt5 and PySide6 installed (which is common during development), QtPy might pick PyQt5 by default. When that happens, uic.loadUi() loads your .ui file using PyQt5's internals, but the rest of your code is using PySide6 — and the two don't mix. Setting QT_API explicitly removes this ambiguity.
If you only have PySide6 installed (and not PyQt5), QtPy will usually auto-detect correctly. But setting the variable explicitly is a good habit regardless — it makes your code's intent clear and avoids surprises if someone runs it in a different environment.
Create GUI Applications with Python & Qt6 by Martin Fitzpatrick — (PySide6 Edition) The hands-on guide to making apps with Python — Save time and build better with this book. Over 15K copies sold.
