When working with PyQtGraph plots, changing the cursor can help with pointing accuracy. For example, if you need to isolate particular points in a scatter plot, a crosshair cursor gives you a more accurate view of where you are pointing than the standard arrow cursor.
In this tutorial, you'll learn two approaches to adding a custom cursor to a PyQtGraph plot: using Qt's built-in cursor shapes and drawing a fully custom crosshair overlay using PyQtGraph's InfiniteLine.
Changing the Mouse Cursor on a PyQtGraph PlotWidget
Changing the mouse cursor in a PyQtGraph plot is fairly simple and uses Qt's built-in support for custom cursors over a widget. Since the PyQtGraph PlotWidget is a subclass of QGraphicsWidget (and therefore QWidget) you can use the standard Qt cursor methods.
    cursor = Qt.CrossCursor
    self.graphWidget.setCursor(cursor)
For the complete list of cursor types, see the Qt documentation.
The example below shows this in action on a simple PyQtGraph plot.
from PyQt5.QtCore import Qt
from PyQt5.QtWidgets import QMainWindow, QApplication
from pyqtgraph import PlotWidget, plot
import pyqtgraph as pg
import sys  # We need sys so that we can pass argv to QApplication
import os

class MainWindow(QMainWindow):

    def __init__(self, *args, **kwargs):
        super().__init__(*args, **kwargs)

        self.graphWidget = pg.PlotWidget()
        self.setCentralWidget(self.graphWidget)

        hour = [1,2,3,4,5,6,7,8,9,10]
        temperature = [30,32,34,32,33,31,29,32,35,45]

        #Add Background colour to white
        self.graphWidget.setBackground('w')
        # Add Title
        self.graphWidget.setTitle("Your Title Here", color="b", size="30pt")
        # Add Axis Labels
        styles = {"color": "#f00", "font-size": "20px"}
        self.graphWidget.setLabel("left", "Temperature (°C)", **styles)
        self.graphWidget.setLabel("bottom", "Hour (H)", **styles)
        #Add legend
        self.graphWidget.addLegend()
        #Add grid
        self.graphWidget.showGrid(x=True, y=True)
        #Set Range
        self.graphWidget.setXRange(0, 10, padding=0)
        self.graphWidget.setYRange(20, 55, padding=0)

        pen = pg.mkPen(color=(255, 0, 0))

        self.graphWidget.plot(hour, temperature, name="Sensor 1",  pen=pen, symbol='+', symbolSize=30, symbolBrush=('b'))

        # Set the cursor for the plotwidget. The mouse cursor will change when over the plot.
        cursor = Qt.CrossCursor
        self.graphWidget.setCursor(cursor)


app = QApplication(sys.argv)
main = MainWindow()
main.show()
app.exec_()
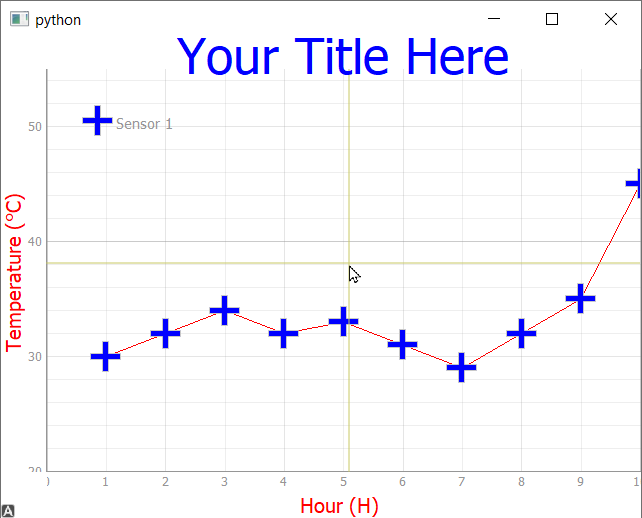
If you run this you'll see a crosshair cursor appear when you hover your mouse over the plot.
 Crosshair cursor on a PyQtGraph PlotWidget
Drawing a Custom Crosshair Cursor with InfiniteLine
If you want to show a completely custom cursor — for example, a full-size crosshair overlay spanning the entire plot — things are a little trickier. In this case you need to draw the cursor yourself by adding elements to the plot and then listening for mouse events to update their position.
The code below is an updated version of the plot above, with two crosshair lines added using PyQtGraph's InfiniteLine objects. The lines are created in the __init__ method and then updated in the update_crosshair method whenever the mouse moves.
Purchasing Power Parity
Developers in [[ country ]] get [[ discount.discount_pc ]]% OFF on all books & courses with code [[ discount.coupon_code ]]You could also add any other QGraphicsScene item here instead.
The important part is the SignalProxy which forwards mouse movement signals to our custom update_crosshair method. The rateLimit parameter
sets the maximum number of signals per second which will be sent, to avoid overloading our handler/app with excessive events.
from PyQt5.QtWidgets import QMainWindow, QApplication
from PyQt5.QtCore import Qt
from pyqtgraph import PlotWidget, plot
import pyqtgraph as pg
import sys  # We need sys so that we can pass argv to QApplication
import os


class MainWindow(QMainWindow):

    def __init__(self, *args, **kwargs):
        super().__init__(*args, **kwargs)

        self.graphWidget = pg.PlotWidget()
        self.setCentralWidget(self.graphWidget)

        hour = [1,2,3,4,5,6,7,8,9,10]
        temperature = [30,32,34,32,33,31,29,32,35,45]

        #Add Background colour to white
        self.graphWidget.setBackground('w')
        # Add Title
        self.graphWidget.setTitle("Your Title Here", color="b", size="30pt")
        # Add Axis Labels
        styles = {"color": "#f00", "font-size": "20px"}
        self.graphWidget.setLabel("left", "Temperature (°C)", **styles)
        self.graphWidget.setLabel("bottom", "Hour (H)", **styles)
        #Add legend
        self.graphWidget.addLegend()
        #Add grid
        self.graphWidget.showGrid(x=True, y=True)
        #Set Range
        self.graphWidget.setXRange(0, 10, padding=0)
        self.graphWidget.setYRange(20, 55, padding=0)

        pen = pg.mkPen(color=(255, 0, 0))
        self.graphWidget.plot(hour, temperature, name="Sensor 1",  pen=pen, symbol='+', symbolSize=30, symbolBrush=('b'))

        # Add crosshair lines.
        self.crosshair_v = pg.InfiniteLine(angle=90, movable=False)
        self.crosshair_h = pg.InfiniteLine(angle=0, movable=False)
        self.graphWidget.addItem(self.crosshair_v, ignoreBounds=True)
        self.graphWidget.addItem(self.crosshair_h, ignoreBounds=True)

        self.proxy = pg.SignalProxy(self.graphWidget.scene().sigMouseMoved, rateLimit=60, slot=self.update_crosshair)

    def update_crosshair(self, e):
        pos = e[0]
        if self.graphWidget.sceneBoundingRect().contains(pos):
            mousePoint = self.graphWidget.getPlotItem().vb.mapSceneToView(pos)
            self.crosshair_v.setPos(mousePoint.x())
            self.crosshair_h.setPos(mousePoint.y())


app = QApplication(sys.argv)
main = MainWindow()
main.show()
app.exec_()
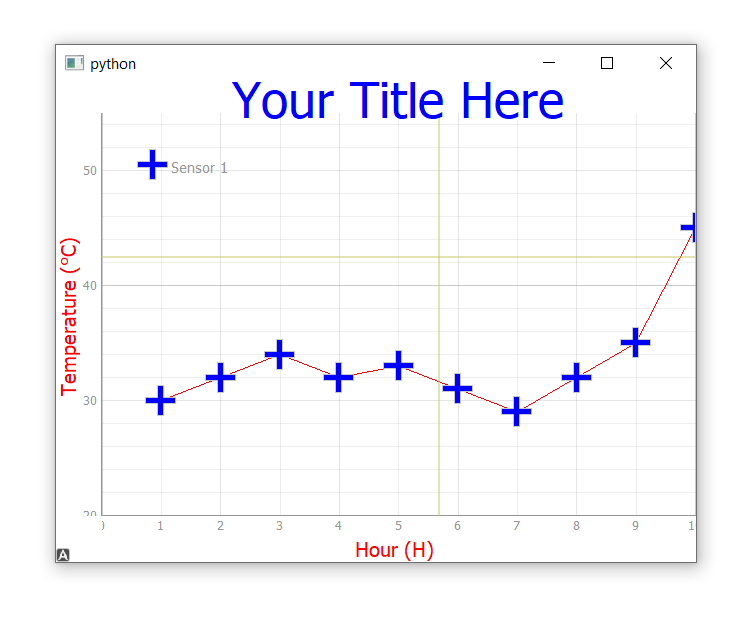
If you run this example, in addition to the mouse cursor you'll also see a faint yellow line overlaying the plot.
 Custom crosshair overlay with the default mouse cursor still visible
Hiding the Default Mouse Cursor Over the Plot
To hide the default mouse cursor over the plot, set the cursor type to Qt.BlankCursor. This gives you a clean crosshair-only cursor experience, which is useful for precise data point selection in PyQtGraph.
class MainWindow(QMainWindow):

    def __init__(self, *args, **kwargs):
        super().__init__(*args, **kwargs)
        # ... rest of __init__ as before

        # Hide the cursor over the plot.
        cursor = Qt.BlankCursor
        self.graphWidget.setCursor(cursor)
This will give the following result when hovering over the plot.
 The custom crosshair cursor with the default mouse cursor hidden
Summary
In this tutorial you learned two ways to customize the mouse cursor on a PyQtGraph PlotWidget in PyQt5:
- Built-in Qt cursors — Use
setCursor()with cursor types likeQt.CrossCursorfor a quick solution. - Custom crosshair overlay — Use PyQtGraph's
InfiniteLinecombined withSignalProxyandsigMouseMovedto draw full-size crosshair lines that track the mouse position across the plot. - Hiding the default cursor — Set
Qt.BlankCursorto remove the OS cursor and show only your custom crosshair.
These techniques work with any PyQtGraph plot type, including scatter plots, line charts, and real-time data visualizations, making them ideal for building interactive Python GUI applications with PyQt5.
Create GUI Applications with Python & Qt5 by Martin Fitzpatrick — (PyQt5 Edition) The hands-on guide to making apps with Python — Save time and build better with this book. Over 15K copies sold.
